
الخلاصة أولاً
الانتقال من دورتين للشحن والتفريغ إلى دورة واحدة مربحة يوميًا لا يُقضي على مشروع تخزين الطاقة في قطاعي التجارة والصناعة.
إنه يغير الطريقة التي يتعين عليك حسابها بها.
كثير من الناس يكتفون بقسمة الإيرادات السنوية السابقة على اثنين. وهذا خطأ.
ما يهم هو الهامش الفعلي المتبقي خلال الدورة الحالية، وما إذا كانت سعة البطارية الآن أكبر من اللازم بالنسبة للحمل الذي لا يزال يدر عائدًا.
شركة KRL Power أنظمة تخزين الطاقة في قطاعي التجارة والصناعة need to be sized against the site’s current settlement method and actual load curve, not against an outdated two-cycle assumption.
ما الذي تغير فعليًّا في عام 2026
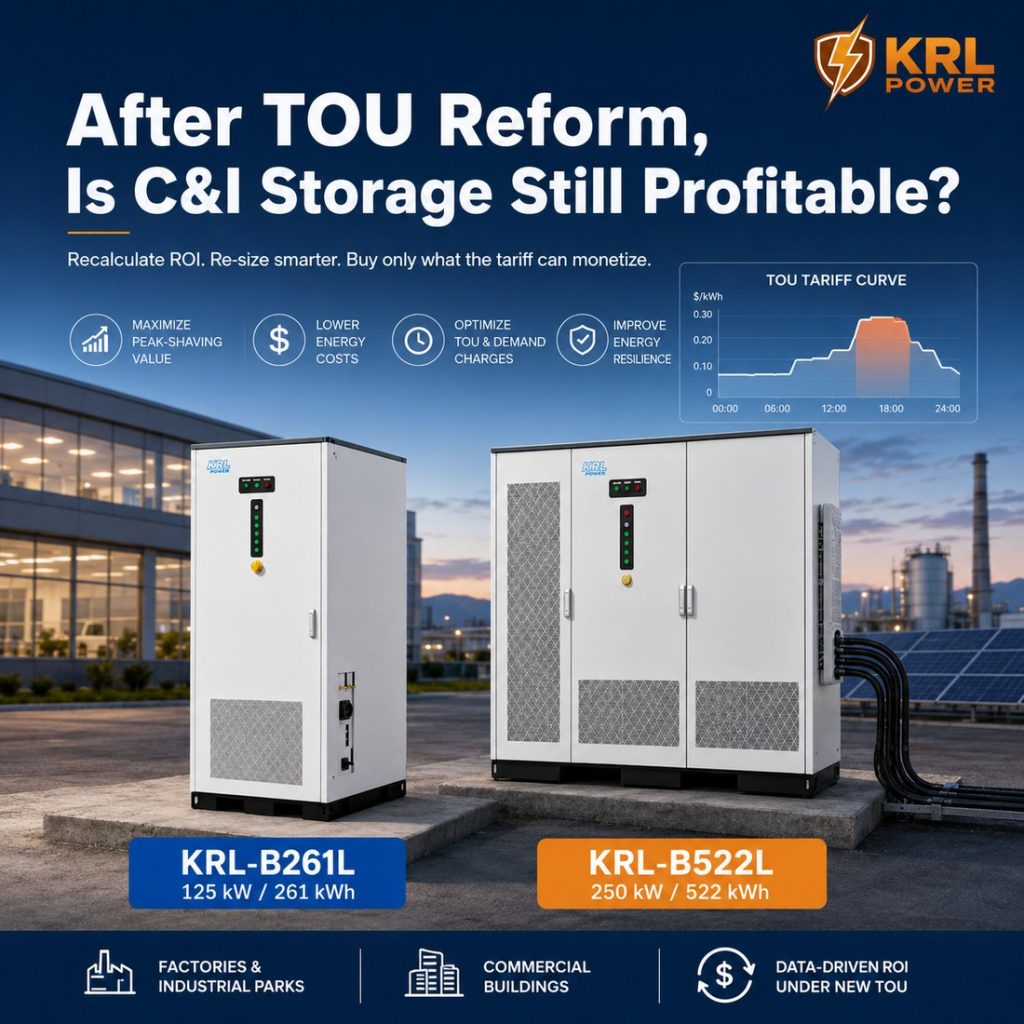
China’s revised القواعد الأساسية لسوق الكهرباء على المدى المتوسط والطويل دخلت حيز التنفيذ في 1 مارس 2026. وبالنسبة للكيانات التي تتداول مباشرة في السوق، لم تعد مستويات الأسعار وفترات الاستخدام المحددة تُفرض بشكل مصطنع.
لا يظل سعر الكهرباء ثابتًا طوال اليوم.
It means you have to use the prices you actually settle under, not a permanent peak-valley table from three years ago. For broader market context, review KRL Power’s تخزين الطاقة في قطاعي الصناعة والتجارة في ظل تحرير سوق الكهرباء.
قبل أن تبدأ في التعامل مع أي جدول بيانات، تأكد من ما يلي:
- عقد البيع بالتجزئة أو العقد السوقي الحالي
- التكلفة الفعلية لفترة الشحن
- نوافذ تصريف حقيقية باهظة الثمن
- بيانات الحمولة لمدة 15 أو 30 دقيقة
- إنتاج الطاقة الكهروضوئية في تلك النوافذ نفسها
- رسوم الاستهلاك أو رسوم السعة
- حدود التصدير
- قيود تشغيل البطارية
لا تقم بإعادة استخدام نموذج ROI قديم حتى يتم تحديث هذه العناصر.
هل يعني «دورة واحدة» انخفاض الإيرادات بمقدار 50%؟
لا.
هذا هو الخطأ الأكثر شيوعًا.
نادرًا ما كانت الدورتان السابقتان متساويتين. فعادةً ما كانت إحداهما أقوى من الأخرى. وإذا اختفت الدورة الأضعف، غالبًا ما يكون انخفاض الإيرادات أقل بكثير من النصف. أما إذا كانتا متشابهتين، فعندئذٍ نعم، يمكن أن يقترب الرقم من 50%.
الطريقة الصحيحة:
القيمة السنوية الجديدة = قيمة كل دورة لا تزال قابلة للتنفيذ من الناحية الاقتصادية
ملاحظة:
Old annual value ÷ 2
Rebuild the model with current tariff data. Simply changing the cycle count is not enough. See also KRL’s دليل حساب عائد الاستثمار في أنظمة تخزين الطاقة للقطاع التجاري والصناعي.
استخدم «فارق السعر الصافي الفعلي»، وليس «الرقم المعلن»
يؤدي حساب الفرق بين أعلى سعر وأدنى سعر إلى المبالغة في تقدير العائد.
ما تحتاجه فعليًّا هو:
هامش الربح الصافي لكل كيلوواط/ساعة من التيار المتردد المُزوَّد
= التكلفة المُتجنبة أثناء التفريغ
− (charging cost ÷ round-trip efficiency)
− variable cycling cost
مثال سريع (للتوضيح فقط)
| الإدخال | القيمة |
|---|---|
| سعر الشحن | 0.30 يوان صيني/كيلوواط ساعة |
| تجنب شراء الكهرباء بأسعار مرتفعة | 1.00 يوان صيني/كيلوواط ساعة |
| كفاءة الرحلة ذهابًا وإيابًا | 90% |
| ركوب الدراجات / بدل التدهور | 0.05 يوان صيني/كيلوواط ساعة |
تكلفة الشحن لكل 1 كيلوواط/ساعة من التيار المتردد الصادر:
0.30 ÷ 0.90 = RMB 0.333
هامش الربح الصافي:
1.00 − 0.333 − 0.05 = 0.617 يوان صيني/كيلوواط ساعة
بدا فارق السعر في العنوان وكأنه 0.70 يوان صيني. لكن الهامش الفعلي أقل من ذلك عند احتساب الخسائر وتكلفة دورات الشحن والتفريغ. لا تستخدم سوى مكونات السعر التي تتغير فعليًّا عند شحن البطارية أو تفريغها.
حساسية الدورة الواحدة
الافتراضات:
1000 كيلوواط/ساعة من الطاقة القابلة للاستخدام عند التفريغ بالتيار المتردد لكل دورة، دورة واحدة في اليوم، 330 يومًا في السنة، سعر الشحن 0.30، كفاءة 90%، تكلفة الدورة 0.05.
| قيمة عالية مقابل السعر | هامش الربح الصافي | المراجحة السنوية |
|---|---|---|
| 0.70 | 0.317 | 104 500 |
| 0.90 | 0.517 | 170 500 |
| 1.10 | 0.717 | 236 500 |
| 1.30 | 0.917 | 302 500 |
دورة واحدة في اليوم لا تعني شيئًا تقريبًا بحد ذاتها. أما العوامل المؤثرة فهي الفارق المسجل، والطاقة القابلة للاستخدام، وأيام التشغيل، وتكلفة الدورة، وتكلفة الاستثمار الرأسمالي المركبة.
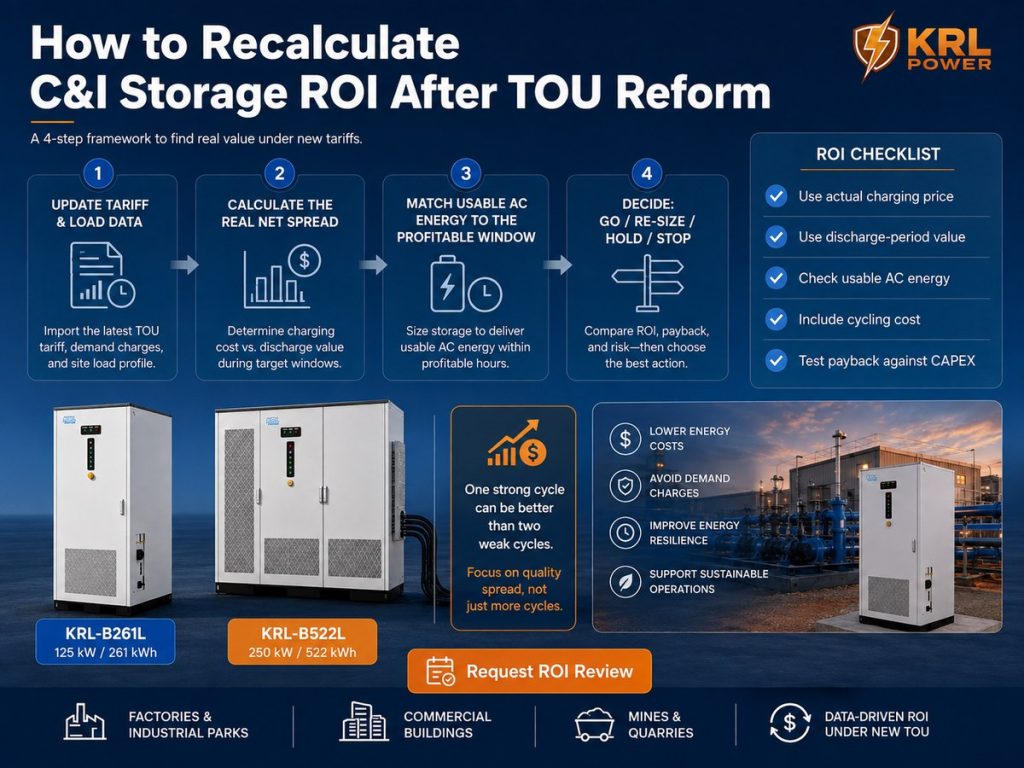
ستة أرقام تحدد مصير المشروع
-
سعر الشحن الفعلي
استخدم السعر الذي ستدفعه البطارية فعليًّا. لا تعتمد تلقائيًّا على سعر الوادي المعلن. -
القيمة الفعلية للتفريغ
استخدم التكلفة التي يمكن للموقع تجنبها فعليًّا. فالسعر الأقصى النظري لا فائدة منه إذا لم يكن المصنع يعمل في ذلك الوقت. -
طاقة التفريغ المربحة
Lowest of: usable battery energy, site load in the profitable window, PCS power × available duration.
هذه هي أسرع طريقة لاكتشاف البطارية ذات الحجم الزائد. -
طاقة التيار المتردد القابلة للاستخدام
الكيلوواط/ساعة الاسمية ليست طاقة تيار متردد قابلة للبيع. يجب مراعاة حدود حالة الشحن (SOC)، والاحتياطي، وخسائر التحويل، والمعدات المساعدة، والتدهور، وقيود التشغيل.
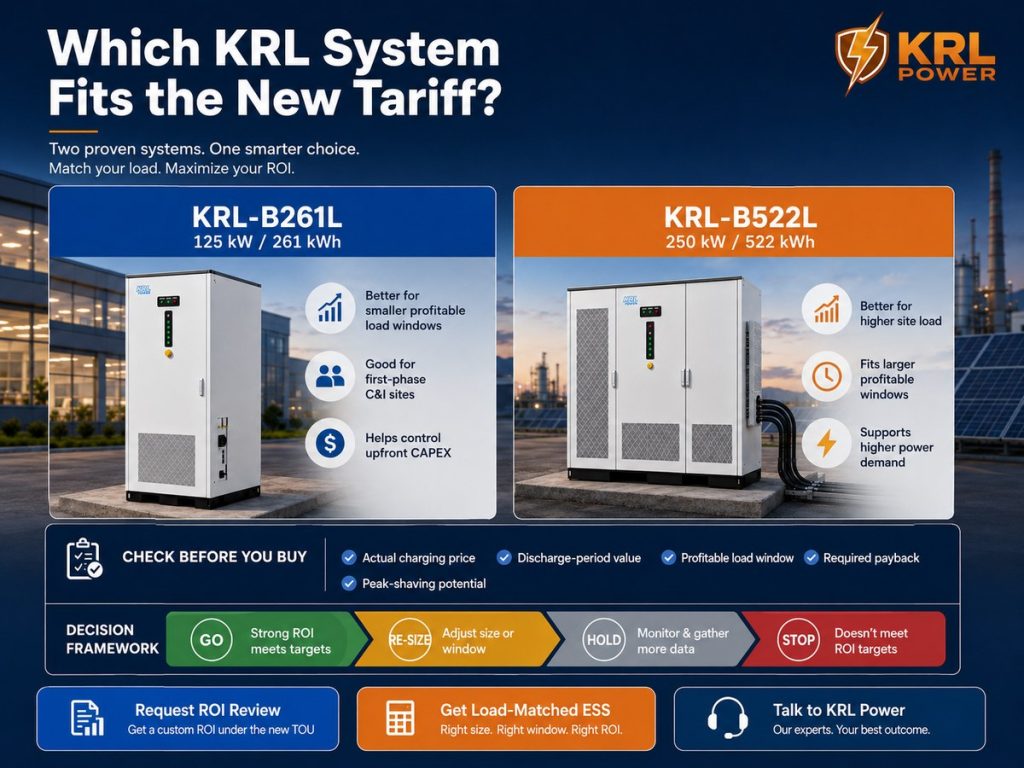
تنشر شركة KRL KRL-B261L بما يعادل 125 كيلوواط / 261 كيلوواط·ساعة و KRL-B522L تبلغ 250 كيلوواط / 522 كيلوواط/ساعة. هذه أرقام مدرجة على اللوحة التعريفية. وبالنسبة لأعمال ROI، فهي لا تمثل طاقة تفريغ تيار متردد مضمونة. -
تكلفة ركوب الدراجات
Do not run a second cycle just because the battery can. Incremental revenue must beat incremental operating and degradation cost. If a weak cycle barely covers losses, leave the battery idle. See also KRL’s نهج تخفيف أحمال الذروة الصناعية. -
الإقرار المطلوب
Positive savings ≠ good investment. Define the hurdle first (4-year or 5-year payback, minimum IRR, cash yield, financing constraint), then see what the site can support.
الحد الأقصى للنفقات الرأسمالية التي يمكن تحملها كمعيار تصفية سريع
شاشة بسيطة:
Maximum affordable CAPEX = Annual sustainable net cash flow × target payback years
Example: RMB 180 000 annual cash flow, 5-year target → RMB 900 000 ceiling.
إذا كانت تكلفة التركيب أعلى بكثير من هذا الرقم، فلا بد من إجراء تغيير ما: إما خفض استهلاك الطاقة، أو خفض القدرة الكهربائية، أو تحسين إدارة توزيع الطاقة، أو إضافة حلول مؤكدة لتخفيف أحمال الذروة، أو تحسين الاستهلاك الذاتي للطاقة الكهروضوئية، أو خفض تكلفة EPC، أو التوقف عن المشروع.
This is only a screening tool. It does not replace full NPV/IRR work. For cost context see KRL’s دليل تكاليف تخزين الطاقة للأغراض التجارية.
عندما تكون البطارية كبيرة جدًّا
قد يؤدي إصلاح نظام التعريفات إلى جعل السعة القديمة أكبر من اللازم، حتى لو كان المشروع لا يزال قابلاً للتنفيذ.
مثال: الطاقة المتاحة المتبقية في المساء تبلغ 380 كيلوواط/ساعة، والطاقة القابلة للاستخدام المقترحة تبلغ 700 كيلوواط/ساعة. وتبقى السعة الزائدة دون استغلال، مما يؤدي إلى ارتفاع النفقات الرأسمالية، وانخفاض معدل الاستخدام، وإطالة فترة استرداد التكلفة.
Size to the profitable load window first. Add capacity only when it has another clear job — demand management, PV shifting, backup, generator optimisation or contracted grid services. For a wider procurement framework, use KRL Power’s دليل اختيار أنظمة تخزين الطاقة التجارية والصناعية.
| منصة KRL | التيار المتردد | الطاقة الاسمية | تناسب بشكل أفضل عندما |
|---|---|---|---|
| KRL-B261L | 125 كيلوواط | 261 كيلوواط/ساعة | نطاق الربح أصغر |
| KRL-B522L | 250 كيلوواط | 522 كيلوواط/ساعة | يمكن أن يستفيد تحميل الموقع من السعة الإضافية |
لا تشترِ الخزانة الأكبر حجمًا لمجرد أنها تخزن كمية أكبر من الطاقة.
دورة واحدة قوية تفوق دورتين ضعيفتين
| الدورة | هامش الربح الصافي |
|---|---|
| A | 0.18 يوان صيني/كيلوواط/ساعة |
| B | 0.65 يوان صيني/كيلوواط ساعة |
يؤدي تشغيل كلا الجهازين إلى زيادة معدل الإنتاجية. قد لا يضيف الدورة «أ» أي شيء يذكر بعد احتساب التلف وتكاليف التشغيل. وغالبًا ما تكون الاستراتيجية الأفضل هي: الشحن خلال الفترة الأقل تكلفة، والتفريغ خلال الفترة الأعلى قيمة، والبقاء في وضع الخمول بقية الوقت.
ولهذا السبب، فإن اتباع نهج سليم نظام إدارة الطاقة (EMS) للقطاعين التجاري والصناعي وهذا الأمر أكثر أهمية من مؤقت ثابت ذي دورتين.
هل يمكن لـ«تقليص الذروة» سد الفجوة؟
أحيانًا.
Total annual value = arbitrage + verified demand-cost reduction + PV self-consumption + contracted DR + other bankable revenue − O&M.
يجب التحقق من كل دفق على حدة. ضع في اعتبارك الحالات الثلاث التالية:
- Conservative — only contracted or directly measurable savings
- Base — highly probable operating value
- Upside — less certain VPP or market opportunities
Do not prop up a weak project by moving uncertain future revenue into the base case. For market context see KRL’s توقعات قطاع التجارة والصناعة لعام 2026.
كما لا يجب إضافة مدفوعات السعة تلقائيًا. تنطبق الآلية الوطنية لعام 2026 على وحدات التخزين المستقلة المتصلة بالشبكة والمستوفية للشروط، وذلك في ظل ظروف محددة. ولا تُعتبر البطاريات المملوكة للمصنع والموجودة خلف العداد مؤهلة تلقائيًا.
ما الذي ينبغي على خدمات الطوارئ الطبية (EMS) تحسينه الآن
الجدول الزمني القديم الثابت:
01:00 charge → 09:00 discharge → 12:00 charge → 18:00 discharge
الهدف الجديد مختلف.
المدخلات: السعر (الحالي أو المتوقع)، توقعات الحمل، توقعات الإنتاج الكهروضوئي، مستوى شحن البطارية (SOC)، الاحتياطي، الحد الأقصى للطلب، حدود الاستيراد/التصدير، تكلفة الدورات التشغيلية، جدول الإنتاج.
الهدف: تحقيق أقصى قدر من القيمة الاقتصادية الصافية, ، وليس الجرد الدوري اليومي.
خمسة مؤشرات تحذيرية في نموذج قديم لحساب العائد على الاستثمار
| إشارة تحذير | الإجراء |
|---|---|
| Still assumes 2 cycles × 365 days | استبدالها بدورات التشغيل وأيام التشغيل الفعلية |
| الكيلوواط/ساعة الاسمية التي تُعامل على أنها تفريغ تيار متردد | إعادة حساب الطاقة القابلة للاستخدام من التيار المتردد |
| فارق التعريفة الجمركية الرئيسية الذي يُعامل كربح | كفاءة الخصم وتكلفة الدورة |
| بطارية ذات سعة أكبر من الحمل خلال الفترة المربحة | تغيير الحجم |
| يعتمد العائد على الاستثمار على إيرادات مستقبلية غير مؤكدة | انقله إلى السيناريو المتفائل |
إذا ظهرت أي من هذه العلامات، فقم بإعادة الحساب قبل الشراء.
انطلاق / تغيير الحجم / تعليق / إيقاف
| النتيجة | القرار |
|---|---|
| تحقيق العائد المطلوب مع توفير مؤكد | انطلق |
| الأداء الاقتصادي جيد، لكن حجم البطارية كبير جدًّا | تغيير الحجم |
| تراجعت عمليات المراجحة، لكن قيمة «تخفيف الأحمال» أو «الطاقة الكهروضوئية» المؤكدة لا تزال قائمة | إعادة التحسين |
| يعتمد العائد على الإيرادات المستقبلية غير المؤكدة | انتظر |
| لا يمكن أن تدعم التكاليف المتبقية والتكاليف الإضافية نفقات رأس المال (CAPEX) | توقف |
ليس كل مشروع يستحق الإنقاذ. يجب أن يكون المورد الجاد مستعدًا لإخبار العميل عندما يكون تقليل سعة التخزين هو الخيار الأفضل.
ما تحتاجه KRL قبل التوصية بأي شيء
- أحدث فاتورة كهرباء
- عقد التسوية
- منحنى الحمل لمدة 15 دقيقة
- القدرة الإنتاجية للطاقة الكهروضوئية والإنتاج
- قدرة المحول
- حد الاستيراد للشبكة
- متطلبات النسخ الاحتياطي
- شروط التصدير
- معدل الاسترداد المستهدف أو معدل العائد الداخلي (IRR)
ولا ينبغي مطابقة المشروع مع الـ... إلا بعد التحقق من هذه العناصر محفظة KRL C&I. بالنسبة للمواقع التي تشهد إقبالاً كبيراً، يرجى مراجعة أيضًا دليل تخفيف أحمال الذروة في القطاع الصناعي. لاتخاذ قرارات تستند إلى التكلفة، استخدم دليل تكاليف أنظمة تخزين الطاقة الكهربائية التجارية إلى جانب نموذج عائد الاستثمار المنقح.
The goal is not to defend yesterday’s battery size.
It is to find the smallest configuration that reliably captures today’s bankable value.
النداء الأخير
يمكن أن يستمر نظام التخزين التجاري والصناعي في العمل حتى بعد إصلاح نظام التعرفة حسب وقت الاستهلاك.
لم يعد نموذج العمل القائم على شحنتين وتفريغين مضمونًا.
قبل أن تنفق المال، أعد الحساب:
- سعر الشحن
- قيمة فترة التفريغ
- فارق السعر الصافي
- الدورات المربحة
- طاقة التيار المتردد القابلة للاستخدام
- الحمل خلال فترة ارتفاع الأسعار
- تكلفة ركوب الدراجات
- القيمة المؤكدة لتخفيف الأحمال في أوقات الذروة
- صافي التدفق النقدي السنوي
- الحد الأقصى للنفقات الرأسمالية التي يمكن تحملها
One strong cycle that meets the required return → انطلق.
Battery too large → تغيير الحجم.
Returns depend on unverified future income → انتظر.
Revised numbers cannot support the cost → توقف.
أفضل مشروع بعد الإصلاح ليس بالضرورة المشروع الذي يتمتع بأكبر قدرة.
إنها التي تحول أعلى نسبة مئوية من السعة المركبة إلى تدفق نقدي قابل للتمويل.
الأسئلة الشائعة
هل لا يزال تخزين الكهرباء في قطاعي التجارة والصناعة مربحًا بعد إصلاح نظام التعرفة حسب وقت الاستهلاك؟
Some projects are. It depends on the remaining net spread, usable energy, site load, cycling cost and CAPEX — not the number of daily cycles.
هل يؤدي الانتقال من دورتين إلى دورة واحدة إلى انخفاض الإيرادات بنسبة 50%؟
ليس تلقائيًا. أعد حساب كل دورة على حدة، واستبعد فقط القيمة التي لم تعد قابلة للتنفيذ.
ما هو الفارق المطلوب؟
There is no universal minimum spread. Use the real net-margin calculation—discharge-period avoided cost minus efficiency-adjusted charging cost and variable cycling cost—then test the resulting annual cash flow against CAPEX and the required return.
كيف ينبغي حساب ربح المراجحة؟
التكلفة المتجنبة أثناء التفريغ ناقصًا تكلفة الشحن المعدلة وفقًا للكفاءة ناقصًا تكلفة الدورات المتغيرة. لا تستخدم الفرق بين سعر الذروة وسعر الوديان وحده.
ما هي البيانات المطلوبة لإعادة حساب عائد الاستثمار؟
استخدم أحدث عقد تسوية أو عقد بيع بالتجزئة، وأسعار الشحن والتفريغ الفعلية، وبيانات الحمل كل 15 دقيقة، وملف تعريف الطاقة الكهروضوئية، ورسوم الطلب أو السعة، وحدود التصدير، وقيود تشغيل البطاريات، وحدود المحولات واستيراد الشبكة، ومتطلبات الطاقة الاحتياطية، وفترة الاسترداد المستهدفة أو معدل العائد الداخلي (IRR).
هل يجب أن تصبح سعة البطارية أصغر بعد تغيير الجدول؟
في بعض الأحيان. إذا كانت فترة التحميل المربحة المتبقية لا تسمح باستخدام السعة الأصلية للبطارية، فإن تقليص السعة يمكن أن يقلل من النفقات الرأسمالية، ويحسن معدل الاستخدام، ويقصر فترة استرداد التكلفة. ولا ينبغي الاحتفاظ بالسعة الزائدة إلا إذا كان لها دور آخر مؤكد.
هل يمكن استخدام السعة الاسمية مباشرةً في النموذج؟
لا. قم بتطبيق حدود SOC، والاحتياطيات، والخسائر، والعناصر المساعدة، والتحلل.
هل يمكن أن يحل «تخفيف الأحمال في أوقات الذروة» محل المربح المفقود من المراجحة؟
في بعض الأحيان. يمكن أن يساعد «تخفيف ذروة الاستهلاك» في سد الفجوة عندما تتسبب فواتير الموقع في تكلفة ملموسة مرتبطة بالطلب، وتكون البطارية قادرة على خفض تلك الذروة المفوترة بشكل موثوق. ولا ينبغي إدراج سوى الوفورات التي تم التحقق منها في السيناريو الأساسي.
هل ينبغي لنظام إدارة الطاقة (EMS) أن يفرض دورتين؟
لا. لا تقم بتشغيل دورة إضافية إلا عندما تتجاوز قيمتها المضافة الخسائر وتكلفة الدورة.
متى ينبغي إيقاف المشروع؟
إيقاف المشروع أو إعادة تصميمه عندما يتبين أن الإيرادات المؤكدة لا تكفي لتغطية العائد المطلوب بعد تعديل حجم البطارية، وطاقة نظام التحكم في الطاقة (PCS)، وافتراضات التوزيع، والوفورات الثانوية القابلة للتمويل.
ما هو التغيير الأكبر الذي سيطرأ بعد إصلاح نظام التعرفة حسب وقت الاستهلاك (TOU) لعام 2026؟
لم يعد بإمكان المشاريع المتعلقة بالتسعير القائم على السوق الاعتماد على فترات الذروة والانخفاض المحددة بشكل دائم. يجب أن تستخدم منصة ROI أسعار التسوية الفعلية ونوافذ التنفيذ.
Does China’s 2026 storage capacity-price mechanism automatically apply to behind-the-meter C&I batteries?
No. The article’s policy section notes that the 2026 national mechanism applies to qualifying grid-side independent storage under defined conditions. A factory-owned behind-the-meter C&I battery does not automatically qualify, so capacity-related revenue should be included only after confirming the project’s actual eligibility and settlement mechanism.
ما هي أسرع طريقة لتقييم مشروع ما بعد الإصلاح؟
احسب صافي الفارق المتبقي، واضربه في الطاقة الواقعية القابلة للاستخدام لتكييف الهواء وعدد أيام التشغيل، وأضف فقط الوفورات الثانوية التي تم التحقق منها، ثم قارن التدفق النقدي الصافي السنوي بعائد الاستثمار المطلوب.
كيف يمكن إعادة حساب عائد الاستثمار في تخزين الطاقة التجارية والصناعية بعد تغيير نظام التعرفة حسب وقت الاستهلاك؟
استخدم سعر الشحن الفعلي، وقيمة فترة التفريغ، وكفاءة الدورة الكاملة، والطاقة المتاحة من التيار المتردد، وتكلفة الدورات، وأيام التشغيل، وحمل الموقع، وتكلفة رأس المال المركبة. استبدل الافتراض القديم القائم على دورتين بالجدول الزمني القابل للتنفيذ الحالي.
كيف ينبغي تقييم الحد الأقصى المسموح به للنفقات الرأسمالية بعد إصلاح نظام التعرفة حسب وقت الاستهلاك؟
لإجراء فحص أولي بسيط، اضرب صافي التدفق النقدي السنوي المستدام في عدد سنوات الاسترداد المستهدفة. إذا كانت تكلفة التركيب أعلى بكثير من هذا الحد الأقصى، فقم بإعادة تحديد الحجم، أو تحسين توزيع التشغيل، أو إضافة تدفقات القيمة المؤكدة فقط، أو خفض تكلفة EPC، أو التوقف عن المشروع. لا تحل طريقة الفحص هذه محل التحليل الكامل للقيمة الحالية الصافية (NPV) أو معدل العائد الداخلي (IRR).
كيف ينبغي للمشتري أن يختار بين طرازي KRL-B261L وKRL-B522L بعد تعديل نظام التعرفة حسب وقت الاستهلاك (TOU)؟
قم بمطابقة النظام مع نطاق الأحمال المربحة، والطلب على الطاقة في الموقع، والعائد المطلوب. يتم الإعلان عن طراز KRL-B261L بقدرة 125 كيلوواط / 261 كيلوواط ساعة، وهو مناسب لنطاقات الربحية الأصغر، بينما يتم الإعلان عن طراز KRL-B522L بقدرة 250 كيلوواط / 522 كيلوواط ساعة للمواقع التي يمكنها الاستفادة من الطاقة الإضافية والطاقة الاسمية. يجب أن يعتمد العائد النهائي على الاستثمار (ROI) على الطاقة القابلة للاستخدام من التيار المتردد الخاصة بالمشروع، وليس على الكيلوواط ساعة المذكورة على اللوحة فقط.