
Allons droit au but
Passer de deux cycles de charge-décharge à un seul cycle rentable par jour ne met pas fin à un projet de stockage destiné au secteur commercial et industriel.
Cela modifie la manière dont il faut le calculer.
Beaucoup de gens se contentent de diviser par deux le chiffre d'affaires annuel de l'année précédente. C'est une erreur.
Ce qui importe, c'est la marge réelle sur le cycle restant et de savoir si la batterie est désormais surdimensionnée par rapport à la charge qui reste rentable.
KRL Power’s Systèmes de stockage d'énergie pour le secteur commercial et industriel need to be sized against the site’s current settlement method and actual load curve, not against an outdated two-cycle assumption.
Qu'est-ce qui a réellement changé en 2026 ?
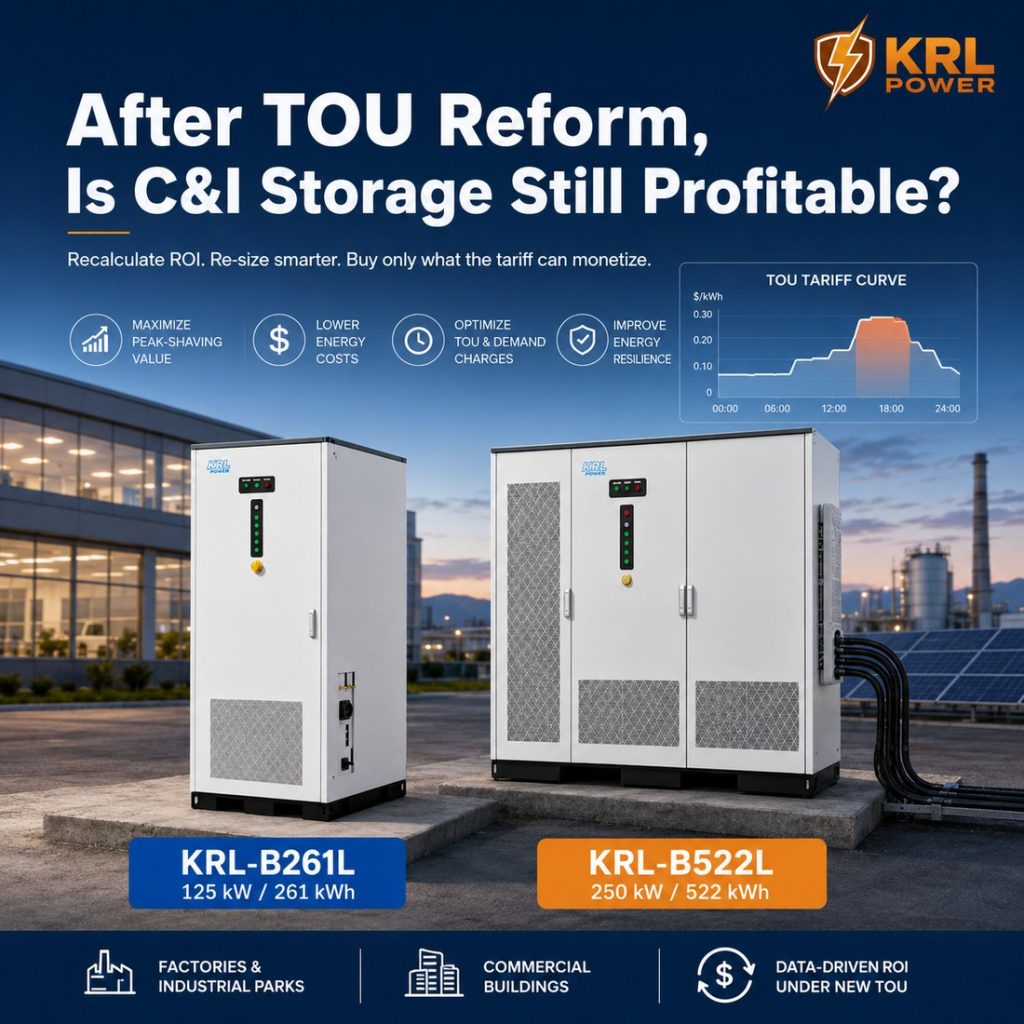
China’s revised Règles de base régissant le marché de l'électricité à moyen et long terme est entrée en vigueur le 1er mars 2026. Pour les entités opérant directement sur le marché, les niveaux et les périodes des tarifs fixes en fonction de l'heure de consommation ne sont plus fixés artificiellement.
Le prix de l'électricité varie au cours de la journée.
It means you have to use the prices you actually settle under, not a permanent peak-valley table from three years ago. For broader market context, review KRL Power’s Le stockage d'énergie dans le secteur C&I dans le cadre de la libéralisation du marché de l'électricité.
Avant de modifier une feuille de calcul, vérifiez les points suivants :
- Contrat au détail ou de marché en vigueur
- Coût réel pendant la période de recharge
- De véritables fenêtres de décharge haut de gamme
- Données de charge sur 15 ou 30 minutes
- Production photovoltaïque au cours de ces mêmes périodes
- Frais liés à la demande ou à la capacité
- Limites d'exportation
- Contraintes d'utilisation de la batterie
Ne réutilisez pas un ancien modèle de ROI tant que celui-ci n'a pas été mis à jour.
Un cycle signifie-t-il une baisse du chiffre d'affaires de 50% ?
Non.
C'est l'erreur la plus courante.
Les deux anciens cycles étaient rarement équivalents. L'un était généralement plus fort que l'autre. Si le plus faible disparaît, la baisse du chiffre d'affaires est souvent bien inférieure à la moitié. Si les deux étaient similaires, alors oui, cela peut avoisiner les 50%.
Approche correcte :
Nouvelle valeur annuelle = valeur de chaque cycle qui reste économiquement viable
Remarque :
Old annual value ÷ 2
Rebuild the model with current tariff data. Simply changing the cycle count is not enough. See also KRL’s Guide de calcul du retour sur investissement des systèmes de stockage d'énergie pour les entreprises et les industries.
Utilisez le spread net réel, et non le chiffre annoncé
La différence entre le cours le plus haut et le cours le plus bas surestime le rendement.
Ce dont vous avez réellement besoin, c'est :
Marge nette par kWh d'électricité alternative fournie
= coût évité pendant la décharge
− (charging cost ÷ round-trip efficiency)
− variable cycling cost
Exemple rapide (à titre purement illustratif)
| Saisie | Valeur |
|---|---|
| Prix de facturation | 0,30 RMB/kWh |
| Éviter l'électricité à prix élevé | 1,00 RMB/kWh |
| Rendement aller-retour | 90% |
| Cycle de vie / coefficient de dégradation | 0,05 RMB/kWh |
Coût de recharge pour 1 kWh de courant alternatif en sortie :
0.30 ÷ 0.90 = RMB 0.333
Marge nette :
1.00 − 0.333 − 0.05 = 0,617 RMB/kWh
L'écart annoncé semblait être de 0,70 RMB. La marge réelle est inférieure une fois les pertes et les coûts liés au cycle pris en compte. Ne tenez compte que des composantes de prix qui varient réellement lors de la charge ou de la décharge de la batterie.
Sensibilité sur un cycle
Hypothèses :
1 000 kWh de décharge CA utilisable par cycle, 1 cycle/jour, 330 jours/an, prix de recharge de 0,30, rendement de 90%, coût de cycle de 0,05.
| Excellent rapport qualité-prix | Marge nette | Arbitrage annuel |
|---|---|---|
| 0.70 | 0.317 | 104 500 |
| 0.90 | 0.517 | 170 500 |
| 1.10 | 0.717 | 236 500 |
| 1.30 | 0.917 | 302 500 |
Un cycle par jour ne vous apprend pratiquement rien en soi. Les facteurs déterminants sont l'écart enregistré, l'énergie exploitable, le nombre de jours de fonctionnement, le coût par cycle et les dépenses d'investissement (CAPEX).
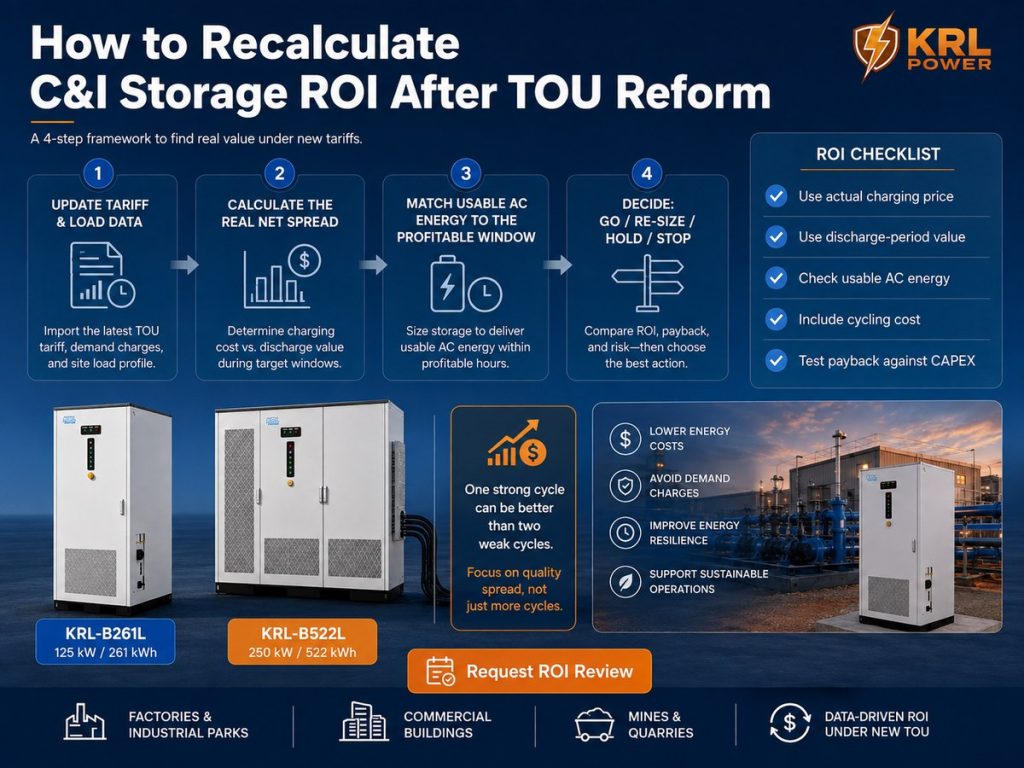
Les six chiffres qui déterminent le projet
-
Prix de facturation réel
Utilisez le prix réel de l'électricité fournie par la batterie. Ne vous fiez pas systématiquement au tarif « en période de faible demande » publié. -
Valeur réelle du débit
Prenez en compte le coût que le site peut réellement éviter. Un prix de pointe théorique ne sert à rien si l'usine n'est pas en production à ce moment-là. -
Énergie de décharge utile
Lowest of: usable battery energy, site load in the profitable window, PCS power × available duration.
C'est le moyen le plus rapide de repérer une batterie trop volumineuse. -
Énergie CA exploitable
Le kWh nominal ne correspond pas à l'énergie CA commercialisable. Il faut tenir compte des limites de SOC, de la réserve, des pertes de conversion, des équipements auxiliaires, de la dégradation et des restrictions d'exploitation.
KRL publie le KRL-B261L soit 125 kW / 261 kWh et le KRL-B522L soit 250 kW / 522 kWh. Il s'agit là de valeurs nominales. Dans le cadre des travaux de ROI, ces valeurs ne correspondent pas à l'énergie de décharge en courant alternatif garantie. -
Coût du vélo
Do not run a second cycle just because the battery can. Incremental revenue must beat incremental operating and degradation cost. If a weak cycle barely covers losses, leave the battery idle. See also KRL’s approche industrielle de lissage de la demande. -
Déclaration obligatoire
Positive savings ≠ good investment. Define the hurdle first (4-year or 5-year payback, minimum IRR, cash yield, financing constraint), then see what the site can support.
« Coût d'investissement maximal abordable » comme filtre rapide
Écran simple :
Maximum affordable CAPEX = Annual sustainable net cash flow × target payback years
Example: RMB 180 000 annual cash flow, 5-year target → RMB 900 000 ceiling.
Si le coût d'installation dépasse largement ce chiffre, il faut changer quelque chose : réduire la consommation d'énergie, diminuer la puissance, améliorer la gestion de la production, mettre en place des mesures vérifiées de réduction des pics de consommation, améliorer l'autoconsommation photovoltaïque, réduire le coût des contrats EPC, ou abandonner le projet.
This is only a screening tool. It does not replace full NPV/IRR work. For cost context see KRL’s Guide des coûts du stockage d'énergie à usage commercial.
Quand la batterie est tout simplement trop grande
Une réforme tarifaire peut rendre l'ancienne capacité surdimensionnée, même si le projet reste viable.
Exemple : le potentiel restant en soirée est de 380 kWh, tandis que l'énergie utilisable proposée est de 700 kWh. La capacité excédentaire reste inutilisée, ce qui augmente les dépenses d'investissement (CAPEX), réduit le taux d'utilisation et allonge le délai de rentabilité.
Size to the profitable load window first. Add capacity only when it has another clear job — demand management, PV shifting, backup, generator optimisation or contracted grid services. For a wider procurement framework, use KRL Power’s Guide de sélection des systèmes de stockage d'énergie à usage commercial et industriel.
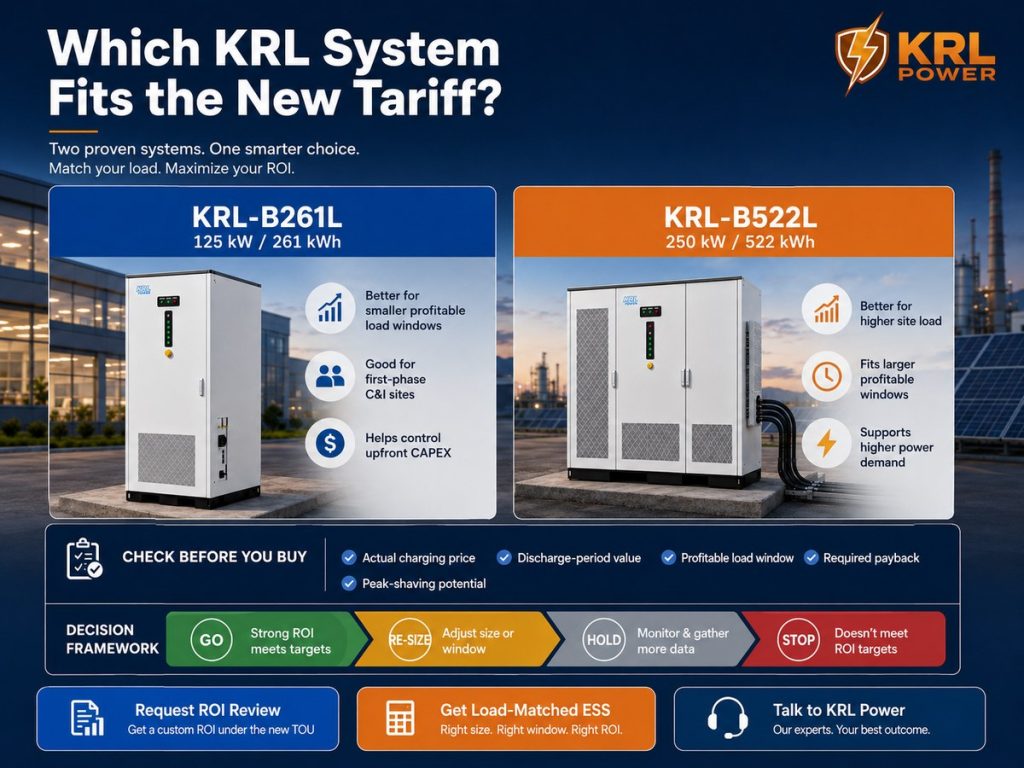
| Plateforme KRL | Alimentation CA | Énergie nominale | Meilleur ajustement lorsque |
|---|---|---|---|
| KRL-B261L | 125 kW | 261 kWh | La fenêtre de rentabilité est plus étroite |
| KRL-B522L | 250 kW | 522 kWh | Le trafic du site peut tirer parti de cette capacité supplémentaire |
N'achetez pas le grand modèle simplement parce qu'il permet de stocker plus d'énergie.
Un cycle solide vaut mieux que deux cycles faibles
| Cycle | Marge nette |
|---|---|
| A | 0,18 RMB/kWh |
| B | 0,65 RMB/kWh |
Le fait de faire fonctionner les deux augmente le débit. Le cycle A n'apporte pratiquement rien après prise en compte de la dégradation et des coûts d'exploitation. La meilleure stratégie consiste souvent à charger pendant la plage horaire la moins chère, à décharger pendant celle qui offre la valeur la plus élevée, et à rester inactif le reste du temps.
C'est pourquoi une bonne C&I EMS est plus important qu’un temporisateur à deux cycles fixe.
Le « peak shaving » peut-il combler ce déficit ?
Parfois.
Total annual value = arbitrage + verified demand-cost reduction + PV self-consumption + contracted DR + other bankable revenue − O&M.
Chaque flux doit être vérifié individuellement. Il convient de distinguer trois cas :
- Conservative — only contracted or directly measurable savings
- Base — highly probable operating value
- Upside — less certain VPP or market opportunities
Do not prop up a weak project by moving uncertain future revenue into the base case. For market context see KRL’s Perspectives pour le secteur C&I en 2026.
N'ajoutez pas non plus automatiquement de paiement de capacité. Le mécanisme national de 2026 s'applique aux systèmes de stockage indépendants raccordés au réseau qui remplissent certaines conditions. Une batterie installée en aval du compteur et appartenant à une usine n'est pas automatiquement éligible.
Ce que les services médicaux d'urgence devraient optimiser dès maintenant
Ancien horaire fixe :
01:00 charge → 09:00 discharge → 12:00 charge → 18:00 discharge
Le nouvel objectif est différent.
Données d'entrée : prix (actuel ou prévisionnel), prévision de charge, prévision de production photovoltaïque, état de charge (SOC), réserve, plafond de demande, limites d'importation/exportation, coût de cyclage, programme de production.
Objectif : maximiser la valeur économique nette, et non un inventaire quotidien.
Cinq signaux d'alerte dans un ancien modèle de retour sur investissement
| Signal d'alerte | Action |
|---|---|
| Still assumes 2 cycles × 365 days | Remplacer par des cycles d'exécution et des jours ouvrables réels |
| kWh nominal considéré comme une décharge en courant alternatif | Recalculer l'énergie CA utilisable |
| Écart tarifaire global considéré comme un bénéfice | Calculer le rendement et le coût du cycle |
| Batterie d'une capacité supérieure à la charge pendant la période de rentabilité | Redimensionner |
| Le retour sur investissement dépend de revenus futurs incertains | Le replacer dans le scénario optimiste |
Si l'un de ces éléments apparaît, refaites le calcul avant d'acheter.
DÉMARRER / REDIMENSIONNER / MAINTENIR / ARRÊTER
| Résultat | Décision |
|---|---|
| Rendement requis atteint, avec des économies vérifiées | GO |
| Coût raisonnable, mais batterie surdimensionnée | REDIMENSIONNER |
| L'arbitrage s'affaiblit, mais la valeur avérée du lissage de pointe ou de l'énergie photovoltaïque demeure | RE-OPTIMISER |
| Le rendement dépend de l'incertitude quant aux revenus futurs | ATTENDRE |
| La marge et la charge restantes ne suffisent pas à couvrir les dépenses d'investissement (CAPEX) | STOP |
Tous les projets ne méritent pas d'être conservés. Un fournisseur sérieux doit être prêt à indiquer à son client quand il vaut mieux opter pour une capacité de stockage moindre.
Ce dont KRL a besoin avant de formuler une recommandation
- Dernière facture d'électricité
- Contrat de règlement
- Courbe de charge sur 15 minutes
- Capacité et production photovoltaïques
- Puissance nominale du transformateur
- Limite d'importation de la grille
- Exigences en matière de sauvegarde
- Conditions d'exportation
- Taux de rentabilité cible ou TRI
Ce n'est qu'après avoir vérifié ces éléments que le projet doit être associé au Portefeuille C&I de KRL. Pour les sites à forte fréquentation, consultez également la Guide sur la réduction des pics de consommation industrielle. Pour les décisions fondées sur les coûts, utilisez le Guide des coûts des systèmes de stockage d'énergie (ESS) à usage commercial ainsi que le modèle de retour sur investissement révisé.
The goal is not to defend yesterday’s battery size.
It is to find the smallest configuration that reliably captures today’s bankable value.
Dernier appel
Le stockage C&I peut continuer à fonctionner après la réforme de la tarification en fonction des tranches horaires.
Deux recharges et deux décharges ne constituent plus un modèle économique garanti.
Avant de dépenser de l'argent, refaites le calcul :
- Prix de facturation
- Valeur de la période de décharge
- Marge nette
- Cycles rentables
- Énergie CA exploitable
- Charge en période de prix élevés
- Coût du vélo
- Valeur vérifiée de réduction des pics de consommation
- Flux de trésorerie net annuel
- Dépenses d'investissement maximales abordables
One strong cycle that meets the required return → GO.
Battery too large → REDIMENSIONNER.
Returns depend on unverified future income → ATTENDRE.
Revised numbers cannot support the cost → STOP.
Le meilleur projet après la réforme n'est pas celui qui dispose de la plus grande capacité.
C'est celle qui permet de transformer le pourcentage le plus élevé de capacité installée en flux de trésorerie bancables.
FAQ
Le stockage d'électricité pour les clients C&I reste-t-il rentable après la réforme de la tarification en fonction des heures ?
Some projects are. It depends on the remaining net spread, usable energy, site load, cycling cost and CAPEX — not the number of daily cycles.
Le passage de deux cycles à un seul entraîne-t-il une baisse du chiffre d'affaires de 50% ?
Pas automatiquement. Recalculez chaque cycle séparément et ne supprimez que la valeur qui n'est plus exécutable.
Quel écart faut-il prévoir ?
There is no universal minimum spread. Use the real net-margin calculation—discharge-period avoided cost minus efficiency-adjusted charging cost and variable cycling cost—then test the resulting annual cash flow against CAPEX and the required return.
Comment faut-il calculer le bénéfice d'arbitrage ?
Coût évité pendant la décharge, moins le coût de charge ajusté en fonction du rendement, moins le coût variable lié aux cycles. Ne pas se baser uniquement sur la différence entre le pic et le creux.
Quelles sont les données nécessaires pour recalculer le retour sur investissement ?
Utilisez le dernier contrat de règlement ou de vente au détail, les prix réels de charge et de décharge, les données de charge toutes les 15 minutes, le profil photovoltaïque, les frais liés à la demande ou à la capacité, les limites d'exportation, les contraintes d'exploitation des batteries, les limites des transformateurs et d'importation sur le réseau, les exigences en matière de secours, ainsi que le délai de rentabilité cible ou le TRI.
La batterie devrait-elle être plus petite suite au changement d'horaires ?
Parfois. Si la plage de charge rentable restante ne permet pas d’exploiter la capacité initiale de la batterie, une réduction de la capacité peut permettre de réduire les dépenses d’investissement (CAPEX), d’améliorer le taux d’utilisation et de raccourcir le délai de rentabilité. Ne conservez la capacité excédentaire que si celle-ci remplit une autre fonction avérée.
La capacité nominale peut-elle être utilisée directement dans le modèle ?
Non. Appliquer les limites SOC, les réserves, les pertes, les éléments auxiliaires et la dégradation.
Le lissage des pics de consommation peut-il compenser la perte d'arbitrage ?
Parfois. Le lissage des pics peut contribuer à combler l’écart lorsque la facturation du site engendre un coût mesurable lié à la demande et que la batterie est en mesure de réduire de manière fiable ce pic facturé. Seules les économies vérifiées doivent être prises en compte dans le scénario de référence.
Le système EMS devrait-il continuer à imposer deux cycles ?
Non. Ne lancez un cycle supplémentaire que si sa valeur ajoutée dépasse les pertes et le coût du cycle.
À quel moment faut-il mettre fin au projet ?
Il convient d'interrompre ou de revoir la conception du projet lorsque les recettes vérifiées ne permettent pas d'atteindre le rendement requis après ajustement de la capacité des batteries, de la puissance du système de contrôle de puissance (PCS), des hypothèses de répartition et des économies secondaires bancables.
Quel est le changement le plus important à la suite de la réforme des tarifs horaires de 2026 ?
Les projets portant sur la tarification basée sur le marché ne peuvent plus s'appuyer sur des périodes de pointe et de creux fixées de manière permanente. Le calcul du retour sur investissement doit s'appuyer sur les prix de règlement réels et les créneaux horaires d'exécution.
Does China’s 2026 storage capacity-price mechanism automatically apply to behind-the-meter C&I batteries?
No. The article’s policy section notes that the 2026 national mechanism applies to qualifying grid-side independent storage under defined conditions. A factory-owned behind-the-meter C&I battery does not automatically qualify, so capacity-related revenue should be included only after confirming the project’s actual eligibility and settlement mechanism.
Quel est le moyen le plus rapide d'évaluer un projet post-réforme ?
Calculez l'écart net restant, multipliez-le par la consommation d'énergie de climatisation réelle et le nombre de jours de fonctionnement, ajoutez uniquement les économies secondaires vérifiées, puis comparez le flux de trésorerie net annuel au taux de rendement requis.
Comment recalculer le retour sur investissement (ROI) du stockage C&I après un changement de tarif horaire ?
Utilisez le prix réel de recharge, la valeur pendant la période de décharge, le rendement aller-retour, l'énergie CA utilisable, le coût des cycles, le nombre de jours de fonctionnement, la charge du site et les dépenses d'investissement (CAPEX) liées à l'installation. Remplacez l'ancienne hypothèse à deux cycles par le calendrier d'exécution actuel.
Comment déterminer le montant maximal des dépenses d'investissement (CAPEX) supportables après la réforme de la tarification en fonction des heures de consommation ?
Pour une première évaluation sommaire, multipliez le flux de trésorerie net annuel durable par le nombre d'années de retour sur investissement visé. Si le coût d'installation dépasse largement ce plafond, revoyez la taille du projet, optimisez la gestion de la production, n'ajoutez que des flux de valeur avérés, réduisez le coût EPC ou abandonnez le projet. Cette méthode de sélection ne remplace pas une analyse complète de la VAN ou du TRI.
Comment un acheteur doit-il choisir entre les modèles KRL-B261L et KRL-B522L suite à la réforme des tarifs horaires ?
Adaptez le système à la plage de charge rentable, à la demande en électricité du site et au rendement requis. Le modèle KRL-B261L, d'une puissance nominale de 125 kW / 261 kWh, convient aux fenêtres de rentabilité plus restreintes, tandis que le modèle KRL-B522L, d'une puissance nominale de 250 kW / 522 kWh, est destiné aux sites pouvant exploiter cette puissance supplémentaire et cette énergie nominale. Le retour sur investissement final doit être calculé en fonction de l’énergie CA utilisable spécifique au projet, et non pas uniquement sur la base des kWh indiqués sur la plaque signalétique.