
By the KRL Power C&I Storage Engineering & Project Finance Team · Last reviewed: November 2026
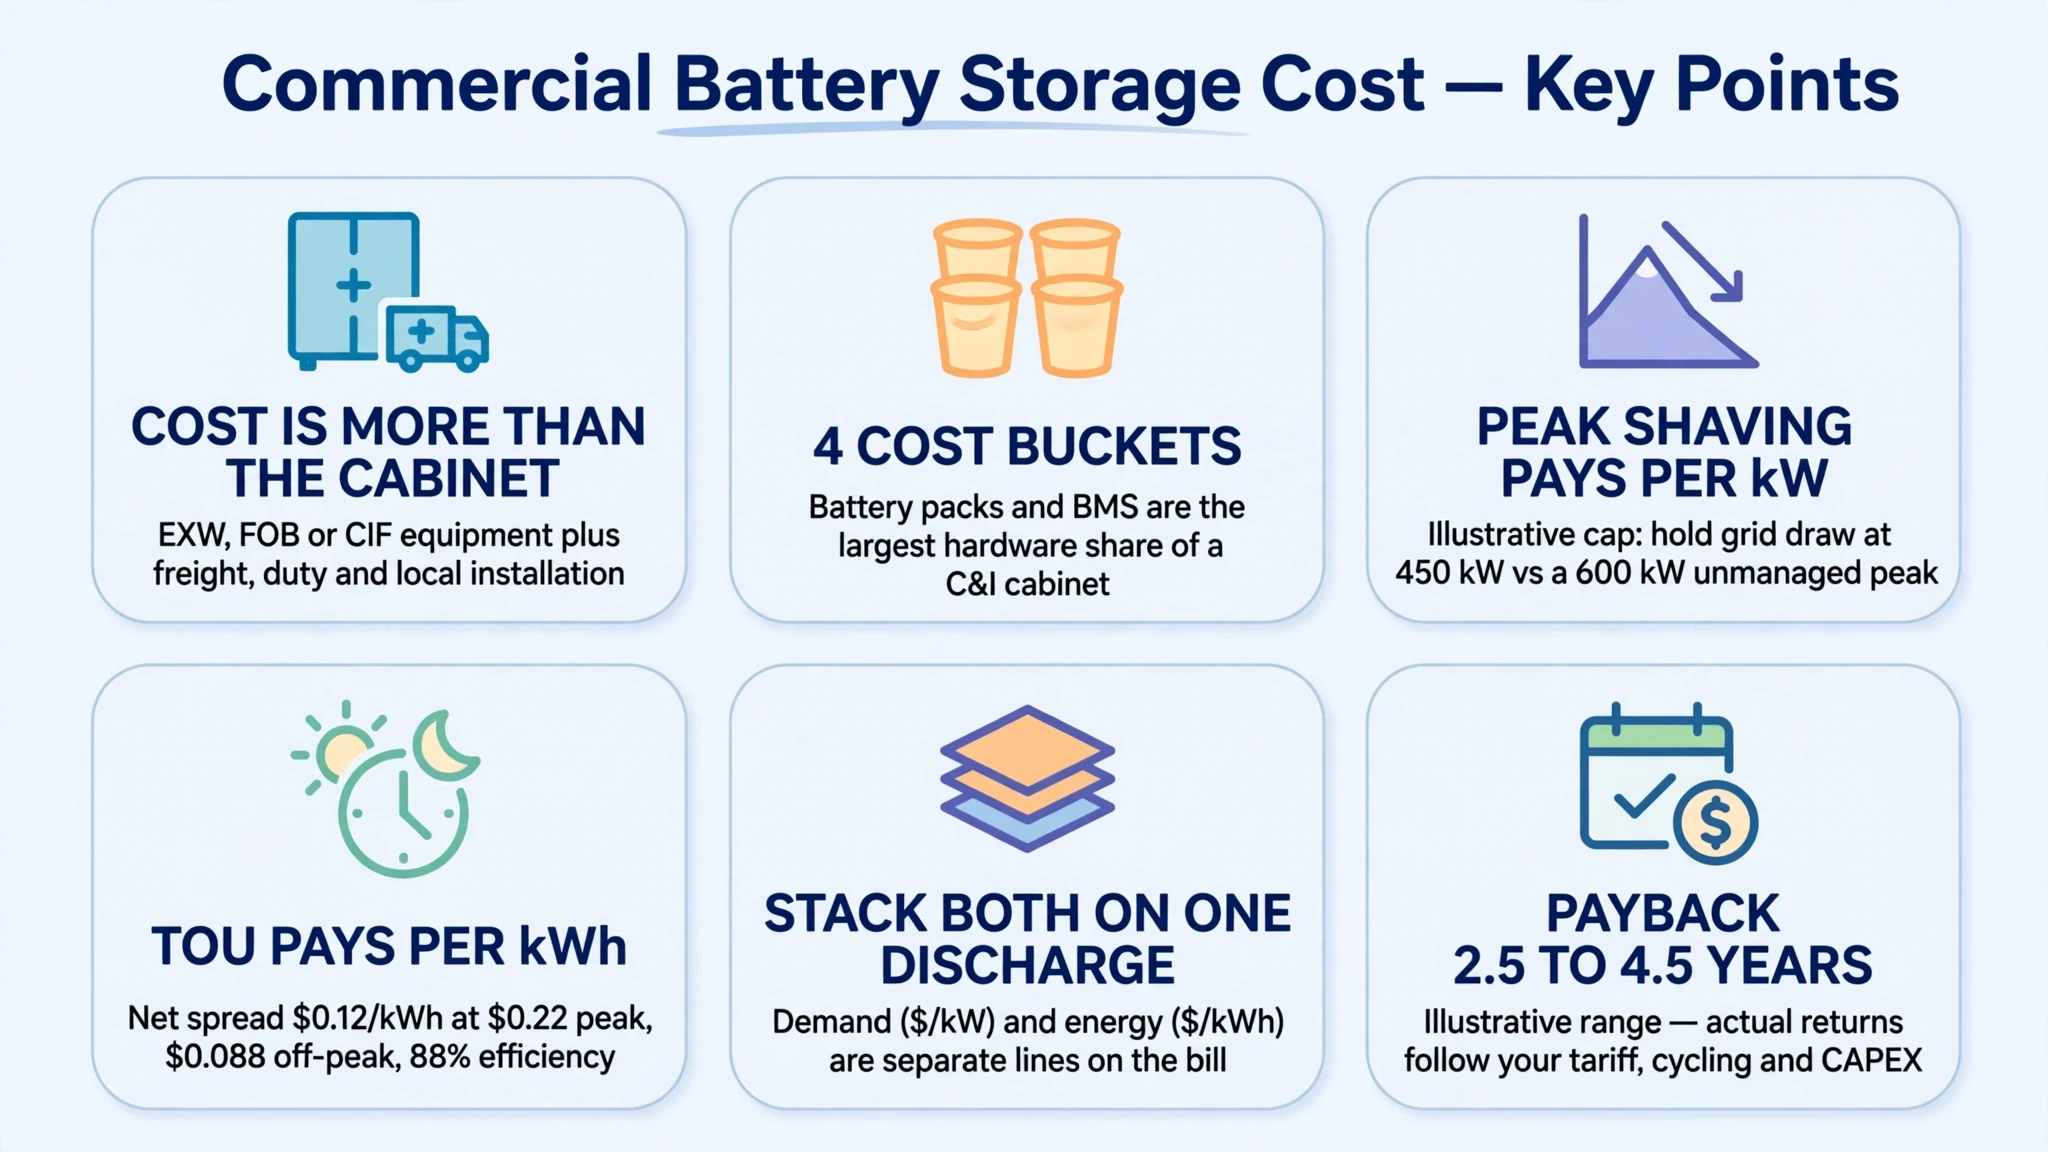
Evaluating commercial battery storage cost in 2026 requires separating equipment hardware costs from shipping terms and site-specific civil and electrical installation work. For factory-integrated LiFePO4 systems between 100kWh and multi-MWh scale, total project expenditure depends on capacity tier, cooling architecture, PCS configuration, trade Incoterms (EXW versus FOB or CIF) and local grid-interconnection scope. Under tariff structures that combine high monthly demand charges with wide peak-to-off-peak price spreads, illustrative project models often estimate a simple payback between 2.5 and 4.5 years, though actual returns depend on site-specific tariffs, cycling frequency and installed capital cost.
This guide breaks down the cost structure across 100kWh, 261kWh, 522kWh and 2–6MWh system tiers, clarifies how EXW, FOB and turnkey installed scopes differ, and walks through a transparent ROI calculation framework that your engineering and finance teams can adapt using an official project quotation.
1. 2026 Commercial Battery Storage Cost Structure: 100kWh, 215kWh & 1MWh BESS Price per kWh Factors
Table 1: KRL Power C&I BESS system tiers, verified specifications and quotation basis
Note: Because cell configurations, PCS grid-code certifications, shipping routes and order volumes vary by project, KRL Power provides customized project quotations rather than fixed public price lists.
| System Tier & Model | Verified Power / Energy & Key Architecture | Typical Commercial & Industrial Applications | Quotation & Pricing Basis |
|---|---|---|---|
| Small-to-Medium C&I (100kWh class): KRL-B100 (50kW / 100kWh) | 50kW / 100kWh all-in-one solar-diesel BESS cabinet; 100kW MPPT solar input; <10ms UPS-grade switching | Commercial buildings, telecom sites, clinics, retail stores and hybrid solar-diesel sites | Contact KRL for EXW / FOB / CIF project quotation |
| Standard C&I Cabinet (215kWh – 261kWh class): KRL-B261L (125kW / 261kWh) | 125kW / 261kWh liquid-cooled all-in-one ESS; ≤3°C cell temperature delta; <10ms switching; parallel scalable | Mid-size manufacturing plants, cold-storage facilities, hotels and commercial complexes | Contact KRL for EXW / FOB / CIF project quotation |
| Heavy Industrial Array (500kWh – 1MWh class): KRL-B522L (250kW / 522kWh) | 250kW / 522kWh liquid-cooled ESS with 240kW MPPT capability (or parallel cabinets scaling to 1MWh+) | Heavy industrial workshops, large commercial hubs and solar-plus-EV charging stations | Contact KRL for single-unit or multi-cabinet quotation |
| Utility & Microgrid Scale (2MWh+ class): KRL-B2M6L (1–2MW / 2–6MWh) | 1–2MW / 2–6MWh containerized liquid-cooled LiFePO4 BESS | Mining microgrids, mega-factories, solar farms and industrial parks | Contact KRL for engineered container quotation |
How to evaluate C&I BESS pricing boundaries when comparing supplier quotes:
- EXW (Ex Works) vs. FOB (Free on Board) equipment boundaries: An EXW quote covers the factory-assembled BESS at the manufacturer's loading bay, excluding domestic inland dangerous-goods haulage, export customs clearance and port handling charges. An FOB quote includes inland transport to the port of loading, export declaration and loading onto the vessel. Always confirm whether a supplier's price per kWh is quoted on an EXW, FOB or CIF (Cost, Insurance and Freight to destination port) basis.
- Turnkey installed cost components: Beyond the equipment quote, a complete landed budget must account for ocean freight, marine insurance, import duties, local inland transport, concrete foundation pads, AC switchgear and transformers, cabling, grid-interconnection approvals and site commissioning labour. Installation costs vary widely across regions: projects in the US, EU, UK and Australia face substantially higher electrical labour, permitting and compliance costs than projects in emerging markets.
Four core cost buckets in a C&I BESS budget
When evaluating total installed expenditure, project budgets break down into four technical categories:
- 1. LFP battery packs and BMS: Prismatic cells built on LiFePO4 battery technology form the largest hardware cost component in a C&I cabinet. Always verify cell grade, batch test reports and the cycle/throughput terms in the warranty document.
- 2. Bidirectional PCS and MPPT solar interface: Covers AC/DC conversion, integrated solar MPPT controllers (such as the 100kW MPPT on the KRL-B100 or 240kW MPPT on the KRL-B522L), on-grid/off-grid transfer for backup power, and reactive power control.
- 3. Thermal management and fire protection: Includes the liquid-cooling chiller or air-cooling unit, gas/smoke sensors and cabinet fire suppression. On the KRL-B261L, liquid cooling maintains cell temperature differences within 3°C to reduce thermal stress in hot climates.
- 4. EMS, balance of system (BOS) and grid interconnection: Covers external transformers, switchgear, cabling, civil foundations, utility protection relays and site commissioning.
Why factory-integrated all-in-one cabinets reduce on-site BOS costs
With split-component procurement, an EPC buys battery racks, PCS inverters, cooling units and fire panels separately, then pays local electricians to assemble DC buswork and debug multi-vendor BMS-to-PCS communication on site. Each field interface adds labour hours, commissioning time and split warranty responsibility.
A factory-integrated all-in-one cabinet ships with the battery packs, PCS, BMS, EMS, thermal management and fire protection pre-wired and factory-tested inside one outdoor enclosure. On-site work narrows to pouring the concrete pad, landing the AC power, PV and communication cables, and running site commissioning checks.
To streamline on-site installation and sourcing, explore KRL Power's full portfolio of turnkey C&I energy storage systems and request a project-matched quotation directly from our factory engineering team.
2. Revenue Stacking: Peak Shaving and Demand Charge Management Explained
2.1 Demand charges ($/kW)
Many commercial and industrial electricity tariffs bill two separate items: energy consumption in kWh and peak power demand in kW. The utility meter records the highest average power draw over a fixed billing interval each month (commonly 15 minutes or 30 minutes) and applies a demand charge per kW. In tariff zones with high demand rates, a short overlap between large motors, chillers or furnaces can set the peak demand charge for the entire billing cycle.
Peak shaving with an EMS operates in three steps:
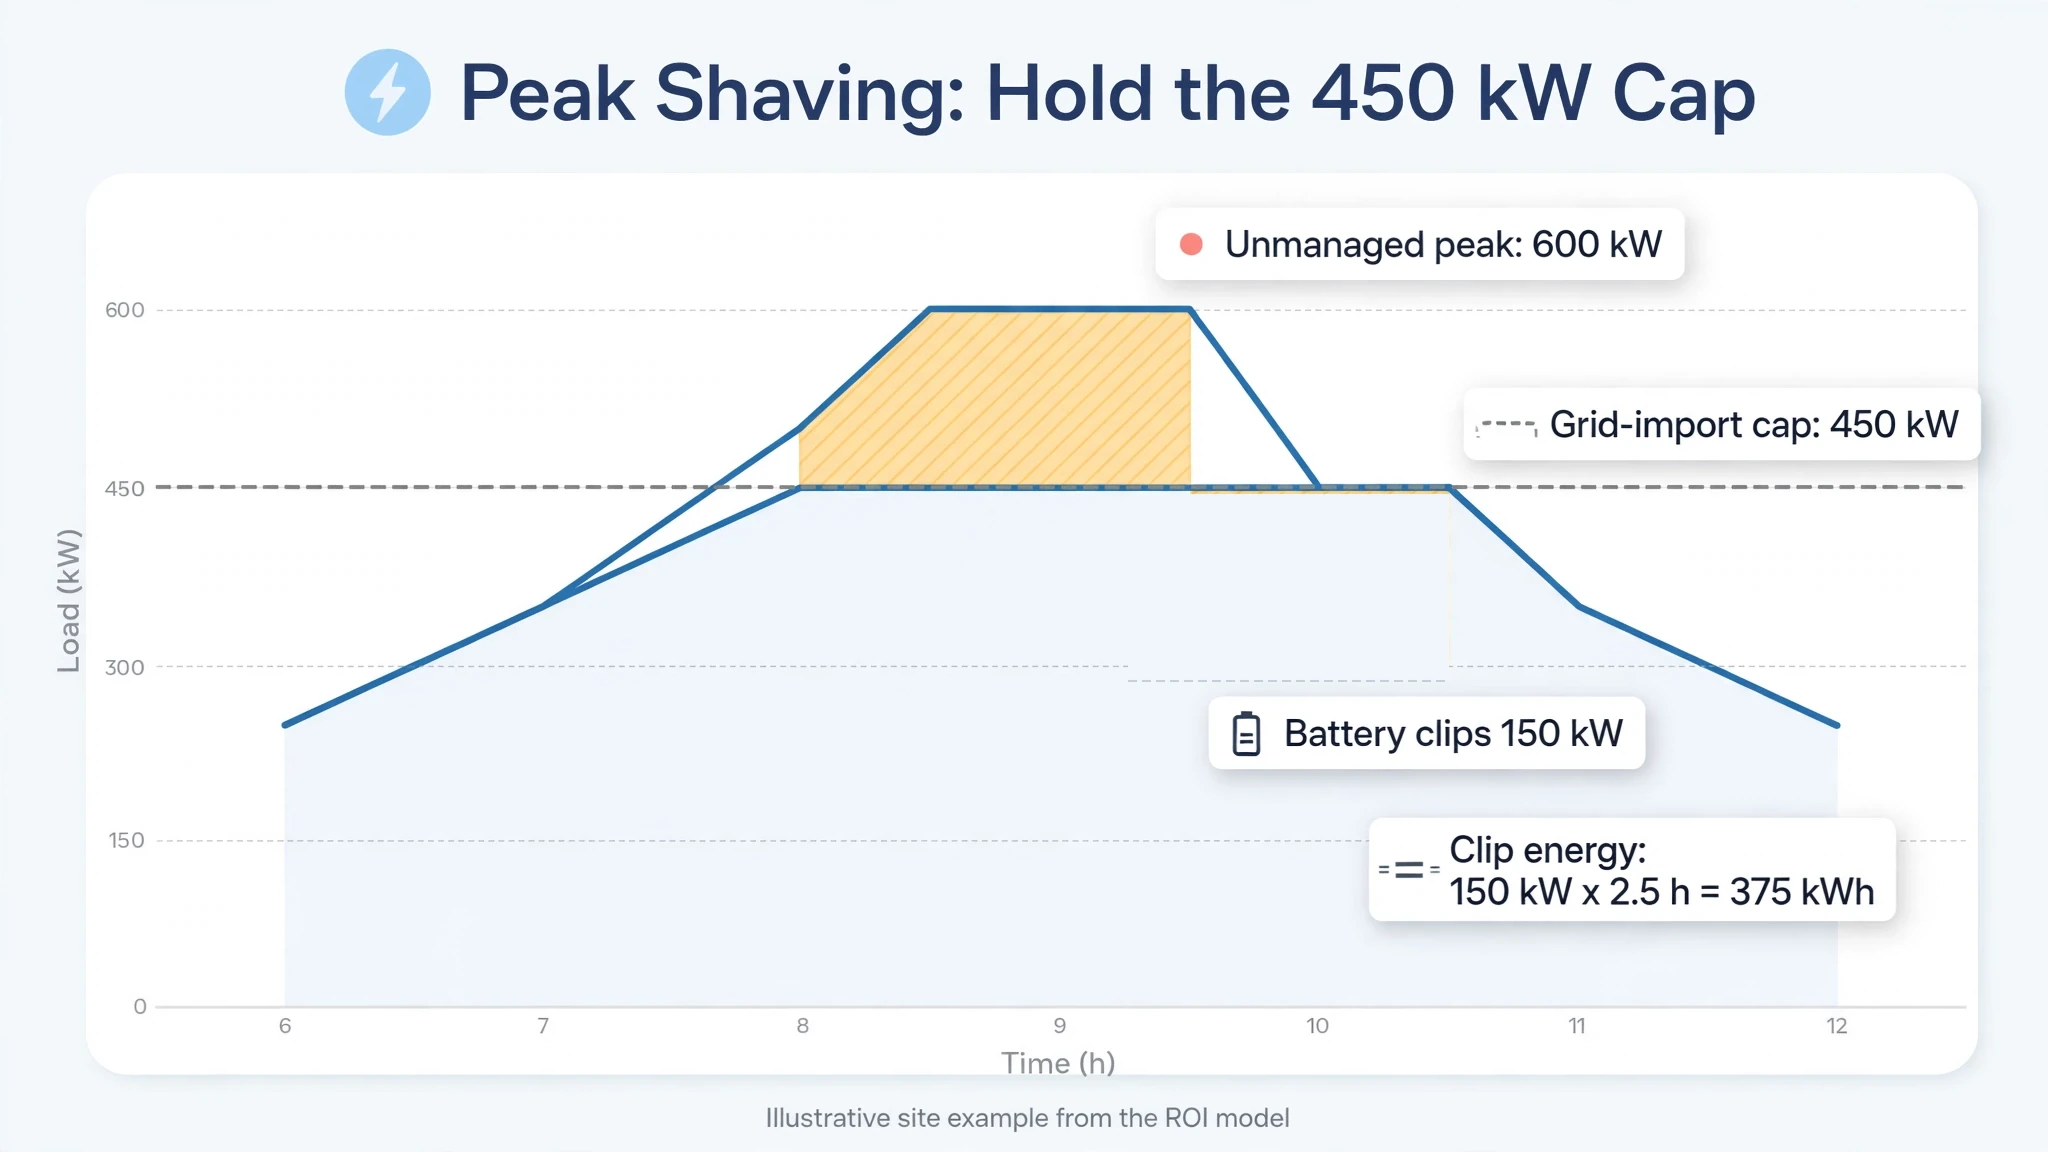
- 1. The facility sets a grid-import threshold (for example, capping grid draw at 450kW on a site whose unmanaged peak reaches 600kW).
- 2. The EMS monitors real-time plant load via current transformers at the main incomer.
- 3. Whenever site load rises toward the threshold, the EMS commands the PCS to discharge battery power and hold grid import at or below the target cap.
2.2 Time-of-use (TOU) arbitrage ($/kWh)
Under a time-of-use tariff, the battery charges during low-rate off-peak hours (or from surplus midday solar PV) and discharges during high-rate peak hours. The net arbitrage spread per discharged AC kWh equals the peak tariff minus the off-peak charging cost divided by AC-to-AC round-trip efficiency. For example, at a $0.22/kWh peak tariff, a $0.088/kWh off-peak tariff and 88% round-trip efficiency:
Net TOU Spread = $0.22 - ($0.088) / (0.88) = $0.12 per discharged AC kWh
2.3 Conditions for stacking demand charge savings and TOU arbitrage
Because demand charges ($/kW) and energy charges ($/kWh) are billed as separate line items on the utility invoice, a single discharge during the peak window can reduce both charges simultaneously, provided two engineering conditions are met:
- 1. Coincident timing and usable AC capacity: The facility's billing peak must occur inside the high-tariff TOU window, and the BESS must have sufficient usable AC energy (after accounting for depth-of-discharge limits, PCS conversion losses and auxiliary cooling loads) to clip the entire peak duration without exhausting its reserve early.
- 2. Accounting boundary: Demand charge savings are determined strictly by the net reduction in the monthly billed peak kW recorded by the utility meter, whereas TOU arbitrage savings are calculated from the actual AC kWh discharged to loads minus the actual AC kWh (and cost) used to recharge the system.
2.4 Additional value streams
- Solar PV self-consumption: Store midday solar generation that would otherwise be curtailed or exported at a low feed-in tariff.
- Reactive power and power factor support: Use the bidirectional PCS to supply reactive power where utilities penalize low power factor.
- Backup power continuity: Protect sensitive production lines during grid outages with fast on-grid/off-grid switching (such as the sub-10ms UPS-level switching supported on the KRL-B261L), reducing scrap batches and diesel generator fuel consumption.
3. Step-by-Step C&I Energy Storage ROI Calculation (Illustrative Case Study)
3.1 Simple payback formula
Simple Payback (years) = (Total Installed Net CAPEX (Equipment + Freight/Duty + Local BOS − Verified Incentives)) / (Annual TOU Savings + Annual Demand Charge Savings + Avoided Outage Cost - Annual O&M)
3.2 Illustrative annual cash-flow model: 250kW / 522kWh system
Consider an illustrative mid-size manufacturing facility with a 600kW unmanaged peak load, 200kWp of rooftop solar PV, a tariff featuring an evening peak window ($0.22/kWh peak vs. $0.088/kWh off-peak) and a $15/kW-month maximum demand charge. The plant evaluates deploying a 250kW / 522kWh liquid-cooled storage configuration, either as a single KRL-B522L (250kW / 522kWh) unit or two parallel KRL-B261L (125kW / 261kWh) cabinets.
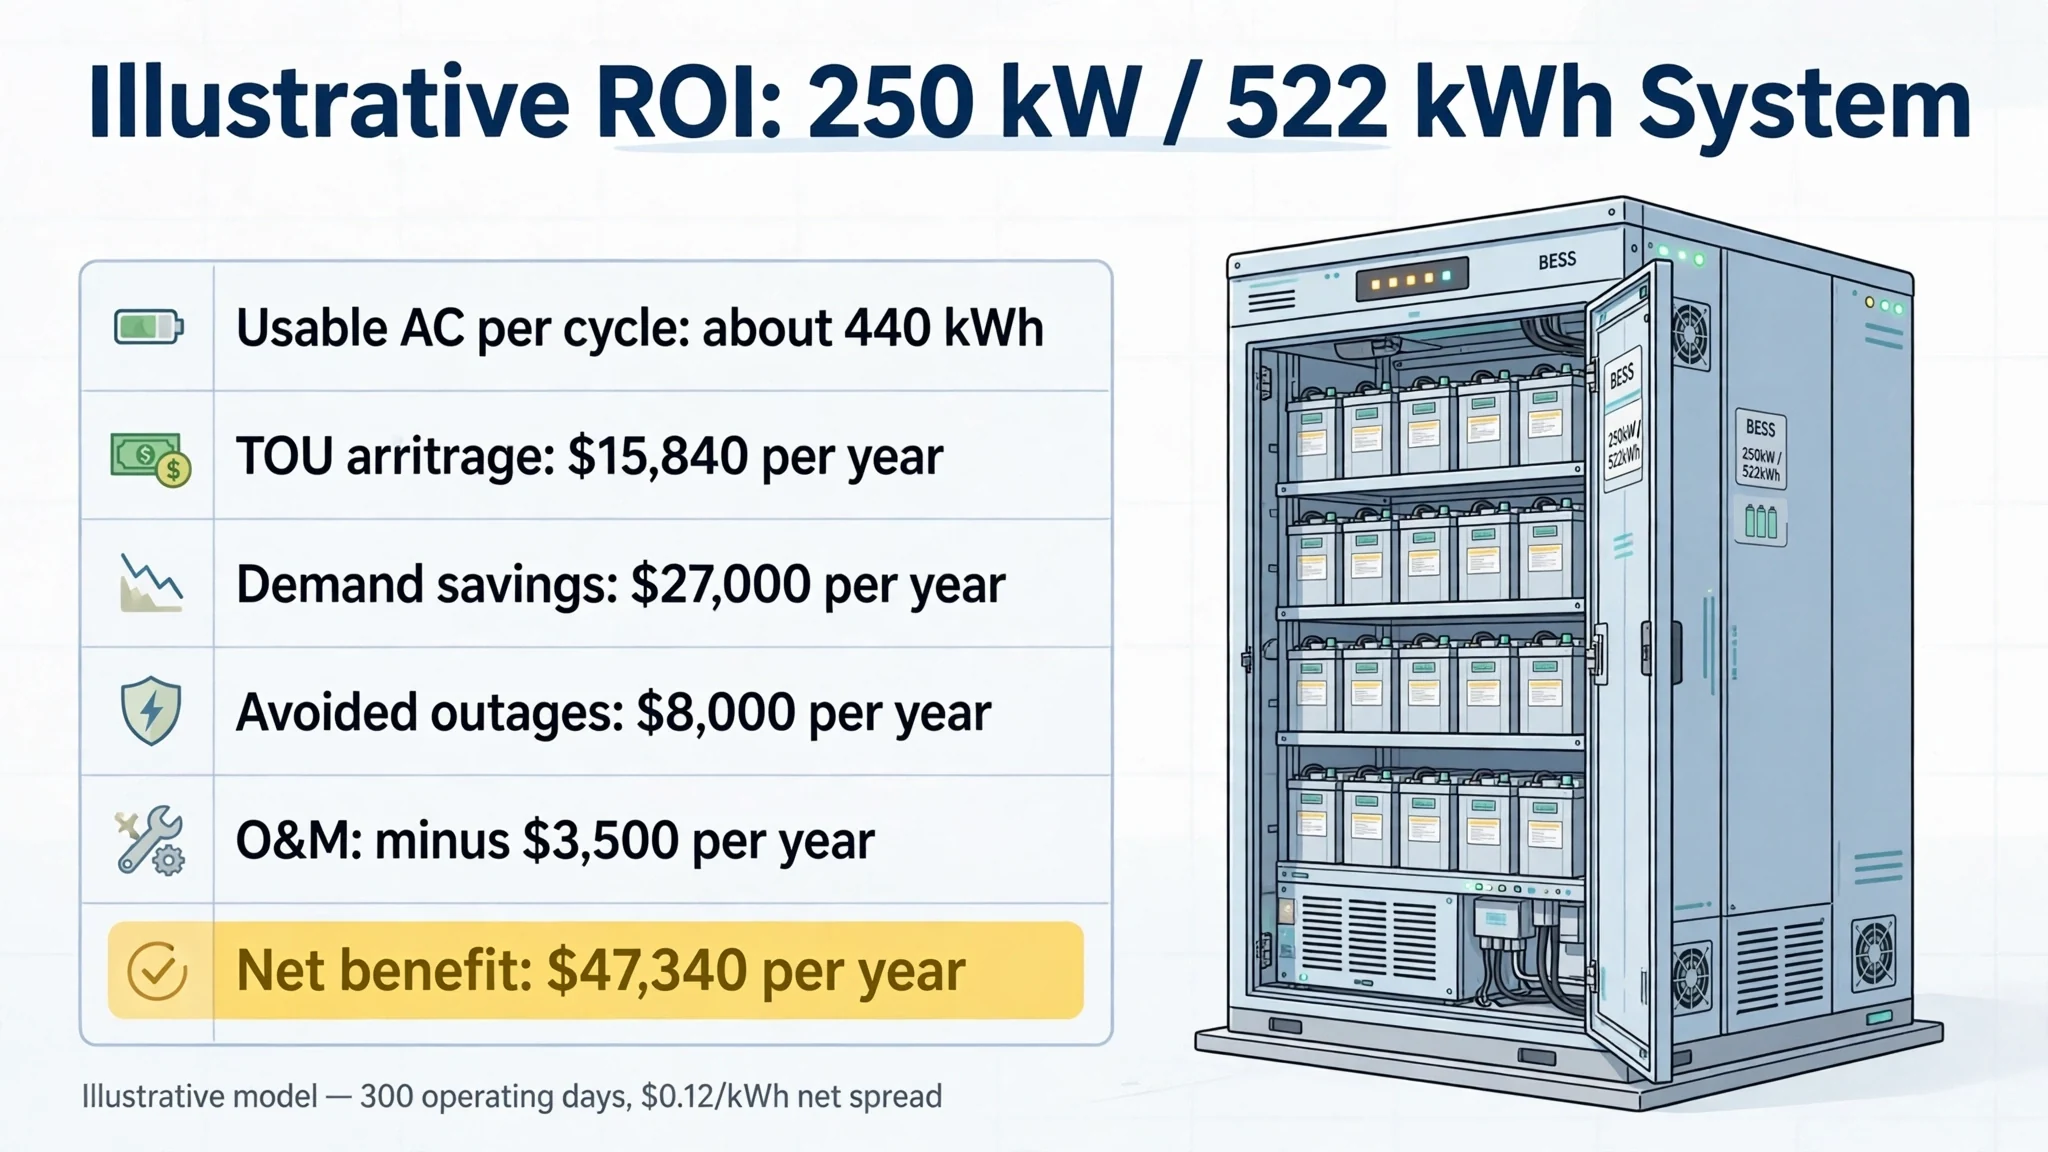
At a 90% depth-of-discharge window, 522kWh nominal capacity yields 469.8kWh of DC energy; after deducting one-way PCS discharge conversion loss (~94% discharge efficiency, consistent with 88% AC-to-AC round-trip efficiency) and liquid-cooling auxiliary load, the model assumes approximately 440kWh of usable AC discharge delivered to site loads per cycle.
Table 2: Illustrative annual revenue calculation (based on stated site and tariff assumptions)
| Value Stream | Model Assumption | Formula / Basis | Illustrative Annual Value |
|---|---|---|---|
| TOU energy arbitrage | 1 cycle/day, 300 operating days/year, $0.12/kWh net AC spread | 440 kWh AC × 300 × $0.12 | $15,840 / year |
| Monthly demand charge reduction | 150kW reduction in billed monthly peak at $15/kW-month | 150 kW × $15 × 12 months | $27,000 / year |
| Avoided outage scrap & diesel fuel | Owner’s historical outage loss and generator fuel logs | Site-specific operational estimate | $8,000 / year |
| Annual O&M and monitoring allowance | Routine inspection, coolant service and insurance estimate | Site-specific operational estimate | −$3,500 / year |
| Net annual operational benefit | $47,340 / year |
Energy and dispatch verification: Clipping 150kW across a peak event lasting up to 2.5 hours requires 375kWh of AC energy, which fits within the 440kWh usable AC cycle budget (with the remaining 65kWh AC discharged during the same peak tariff window). During peak hours, the EMS prioritizes holding the 450kW grid-import cap so that a single unprotected 15-minute spike does not erase the month's demand savings. If a facility's peak plateau lasts longer than the battery's usable AC duration, the achievable kW demand reduction must be scaled down accordingly.
How to complete the payback calculation for your site: Once you obtain an official EXW/FOB/CIF equipment quotation from KRL Power and a local electrical contractor's BOS installation quote, divide your total net installed CAPEX by your calculated net annual benefit ($47,340/year in the illustrative example above). In markets with high demand charges, wide TOU spreads (or two-cycle-per-day solar-plus-grid recharging) and verified tax incentives, estimated payback periods often fall between 2.5 and 4.5 years, whereas sites with flat tariffs and high local installation costs will see longer payback horizons.
3.3 Key sensitivity factors for project finance due diligence
- 1. Daily cycle count vs. warranty throughput: Running two cycles per day across 300 days equals 600 cycles per year (6,000 cycles over 10 years). Before modeling two daily cycles, verify that the system's rated cycle life and warranted energy throughput cover that schedule.
- 2. Tax incentives and sourcing compliance: Tax deductions and credits depend strictly on local law and project structure. In the United States, for example, 2026 energy storage investment tax credit (ITC) rules include foreign-entity (FEOC) sourcing restrictions (as detailed in IRS Notice 2026-15 guidance), and imported battery systems are subject to tariff schedules. Always confirm incentive eligibility with a qualified local tax adviser based on your specific procurement and construction facts.
- 3. Degradation and discounting: For bankable investment committee models, apply annual capacity fade, local tariff escalation and your company's weighted average cost of capital (WACC) rather than relying solely on year-one simple payback.
3.4 Sizing guidelines: Preliminary screening vs. formal engineering design
When choosing between a 100kWh cabinet, a 261kWh cabinet, a 522kWh system or a multi-MWh container, distinguish between quick screening rules of thumb and formal engineering design:
- Preliminary screening assumptions (for early feasibility only): When 15-minute interval meter data is not yet available, engineers sometimes use 20% to 30% of the distribution transformer rating as an initial power screening estimate, and add 10% to 20% capacity headroom when roughing out years 8 to 10 energy requirements. These percentages are preliminary screening assumptions and must not be used as universal final engineering standards.
- Formal engineering sizing (required before procurement):
- — Power (kW): Analyze 12 months of 15-minute or 30-minute utility interval data to measure the exact kW peak height and duration above your target demand threshold, plus any motor-starting inrush requirements during off-grid backup.
- — Nominal vs. actual usable duration (hours): While a 125kW / 261kWh system has a nominal ratio of roughly 2.1 hours (261 ÷ 125 = 2.088 hours), actual usable discharge duration is lower once you deduct the configured SOC operating window (depth of discharge), PCS conversion losses, liquid-cooling auxiliary power consumption and any reserved backup SOC floor.
FAQ
How much does a 100kWh or 1MWh commercial battery storage system cost?
What is the typical payback period (ROI) for C&I energy storage?
How do EXW, FOB and CIF quotations change the cost of a commercial battery system?
Which budget categories should EPC buyers include beyond the battery cabinet price?
How are demand-charge savings calculated for a peak-shaving BESS?
Can demand charge reduction and time-of-use energy arbitrage be earned during the same discharge?
How much usable AC energy does the illustrative 250kW / 522kWh system deliver?
What information is needed for a project-specific C&I BESS sizing and ROI assessment?
How should buyers choose between KRL-B100, KRL-B261L, KRL-B522L and KRL-B2M6L?
How does cycling frequency affect BESS payback and lifetime cost?
4. Conclusion & Request a Project Sizing & Quotation Assessment
Calculating a reliable return on investment for commercial battery storage starts with pairing your facility's actual utility tariff and load curve with an accurate equipment quotation.
- Review technical specifications across KRL Power's C&I lineup, from the KRL-B100 (50kW / 100kWh) commercial cabinet and KRL-B261L (125kW / 261kWh) liquid-cooled ESS to the KRL-B522L (250kW / 522kWh) industrial storage system and KRL-B2M6L (1–2MW / 2–6MWh) containerized BESS.
- Ready to evaluate your project? Contact KRL Power's C&I storage engineering team with your site load profile, recent electricity bill and target delivery port to receive preliminary sizing guidance and a customized project quotation evaluation.